This site foccuses on my own Percentile Bands that is explained in the Excel spread sheet that you can download via this post. Price Headleys accelleration bands are also explained there with litterature references that you can also find on this related site, BandTrading.com, more precisely in the litterature post.
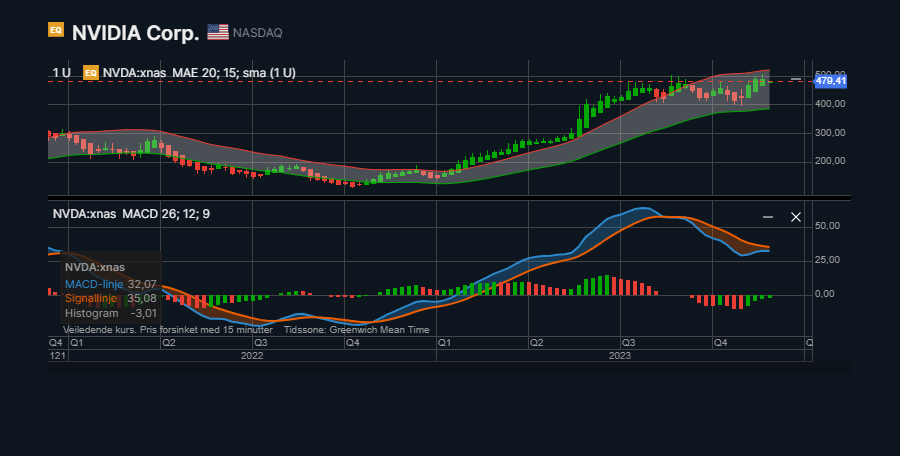
In his book, “Big trends in trading” Price Headley also explains how simple Moving Average Envelopes can be used in market timing. Moving Average Envelopes are simply a moving average of the price surrounded by the same average x % above and below the middle average. For weekly data Headly uses 15 % above and below the 20 week simple moving average. Most brokers have a technical analysis platform where you can set this up yourself, as illustrated here on SaxoBank’s SaxoTrader Go for NVIDIA with candle sticks price, weekly data and two year periode. MACD with MACD histogram in the chart below.
For additional information see this article on my site with identical title.
Leave a Reply